Predictive Maintenance
Empower developers with end-to-end visibility from build to production.
ANTICIPATE FAILURES, NOT JUST RESPOND TO THEM
Before this solution, maintenance engineers relied on customer complaints and repeated site visits to diagnose issues with refrigeration units. This reactive approach led to costly equipment replacements and poor customer experience.I designed the initial experience to help maintenance engineers teach the AI what anomalies may look like. By enabling engineers to analyze equipment behavior and label anomalies, we accelerated the model’s learning while surfacing early warning signs of failure.


Complex Domain

Cross-functional Collaboration

MVP Design Under Ambiguity
MY ROLE
Principal UX Designer
COMPANY
Panasonic
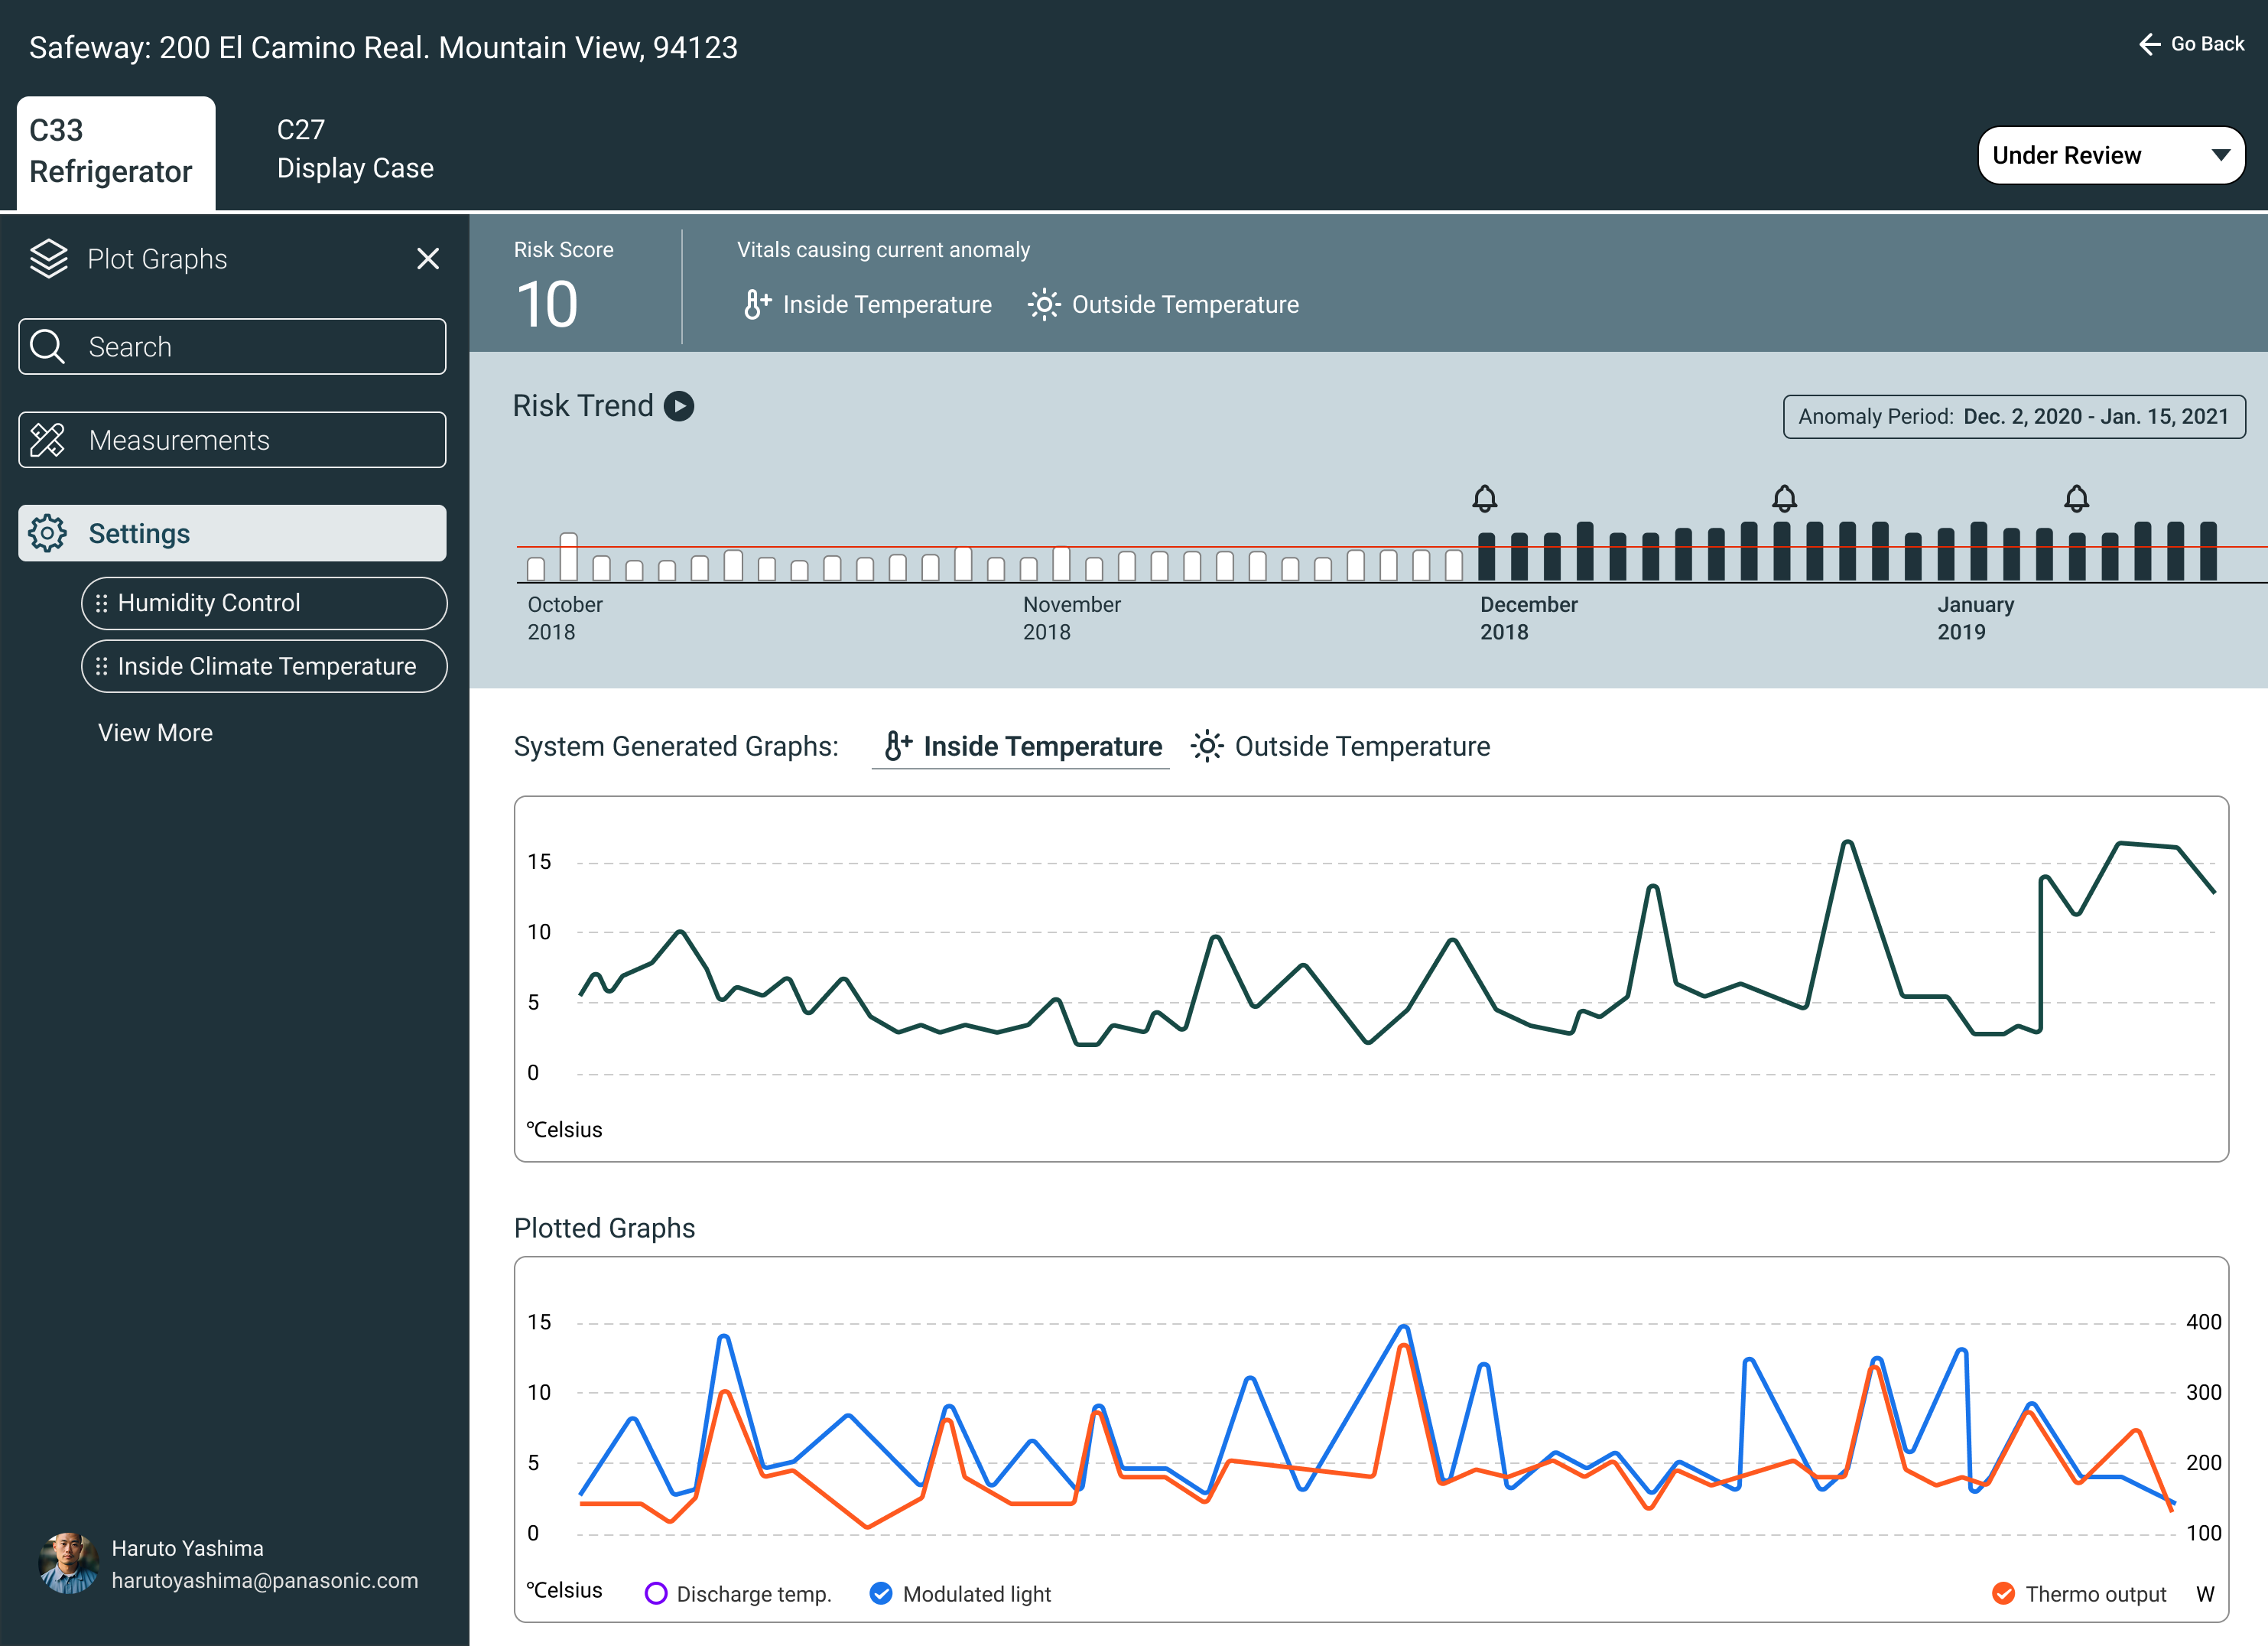
IMPROVING ANOMALY DETECTION AND TEACHING AI
Initial predictive maintenance dashboard enabling engineers to label anomalies and train the model
PRODUCTIVITY GAIN
3x

Engineers resolved 30 anomaly cases/day (vs. 10/day originally)
MODEL TRAINING
Faster AI learning
Human input accelerated anomaly detection and pattern recognition
BACKGROUND
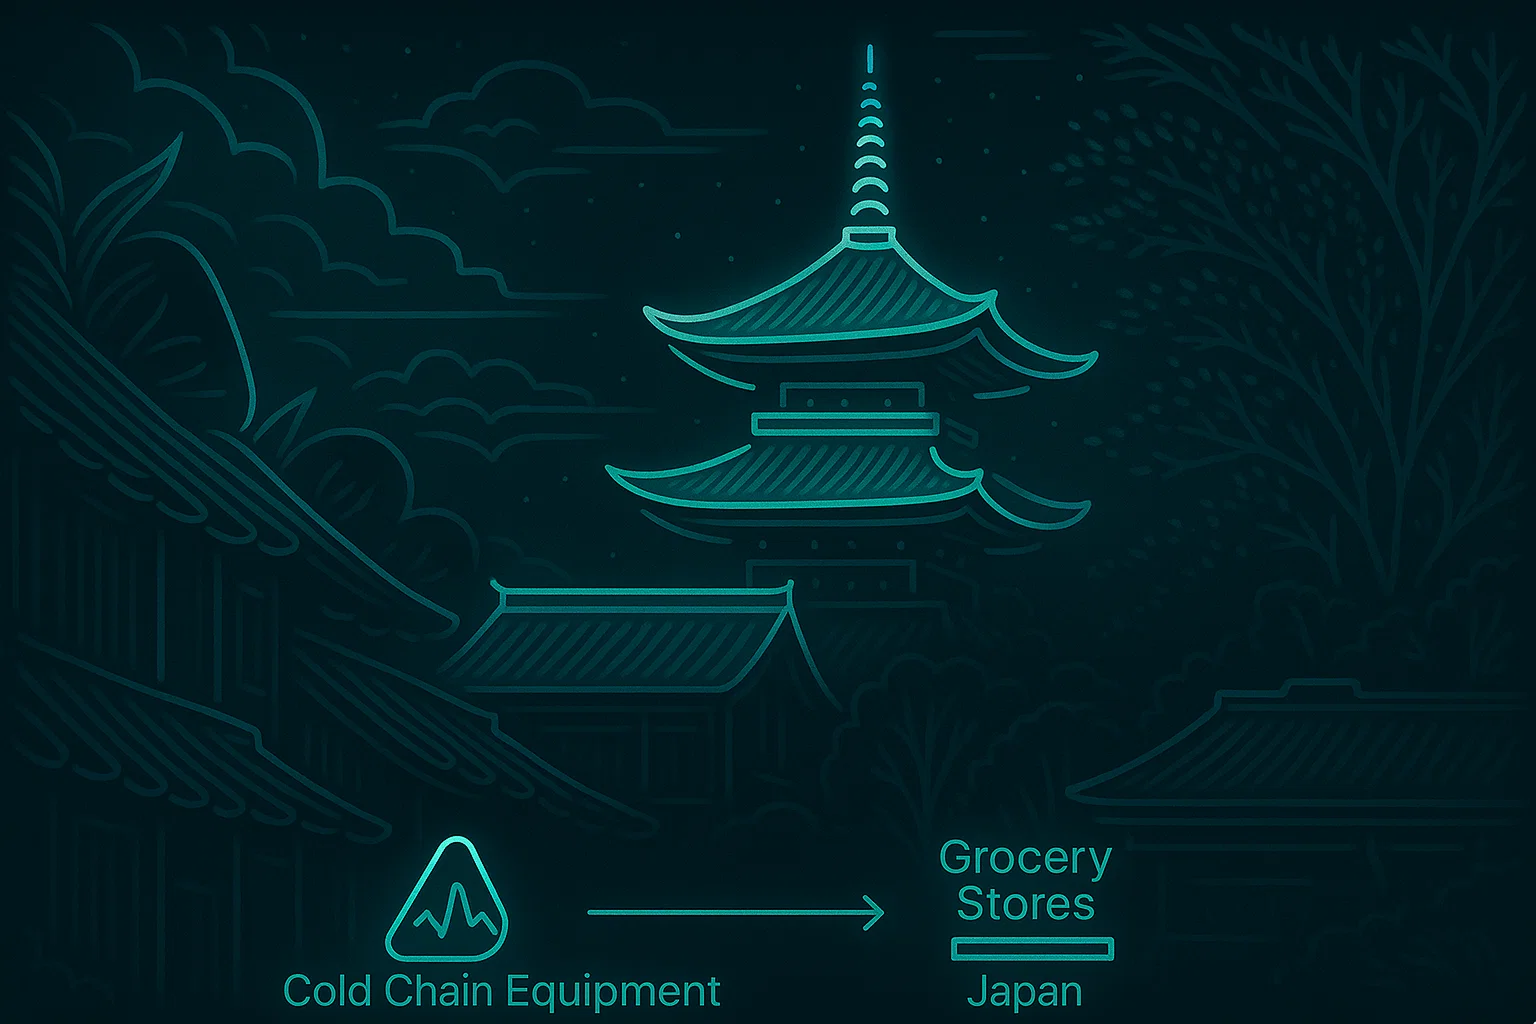
Panasonic


Sells & Maintains Refrigerators
To

Large Scale
Grocery Stores


Nationwide UseAll Over Japan
PROJECT BACKGROUND
Top Frustrations Shared by VI Admins During Contexual Enquriry
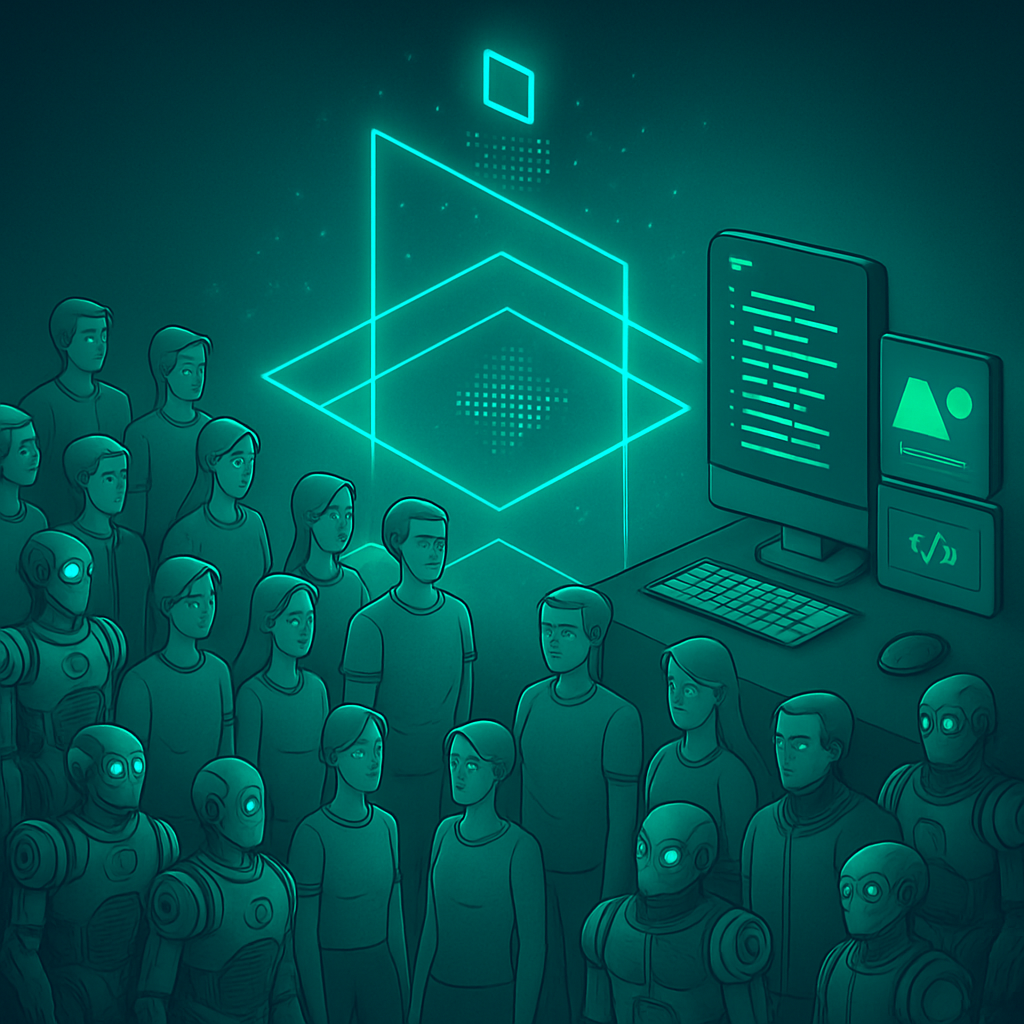
The Data Science & Panasonic Cold Chain teams had spent 18 months building an AI model.
It was time to visualize this work. I had only 2 weeks of design time.
The biggest challenge? I didn’t know anything about the users and how do they mitigate issues.
I influenced the team to consider the MVP as an hypothesis to be validated post implementation
DESIGN WORKSHOP SESSIONS
Pre-Design Workshop for MVP Direction
Why it mattered:
Before designing the MVP, we needed clarity on:
- Project goals
- Target users
- The meaning of product scalability
Without this, the MVP risked misalignment with long-term vision.
What I did:
- Facilitated a pre-design workshop to gather diverse inputs
- Defined the agenda and prepared materials in advance
- Ensured participation from product, engineering, and business stakeholders
- Ran warm-up exercises to encourage open discussion
- Captured insights on user needs and scalability definitions
The result:
The session helped frame the MVP with shared understanding. It reinforced that design isn’t done in a silo and ideas emerged from across teams.

DESIGN WORKSHOP OUTPUT
Collaboration With Product Management, Engineering & Data Scientists
Persona
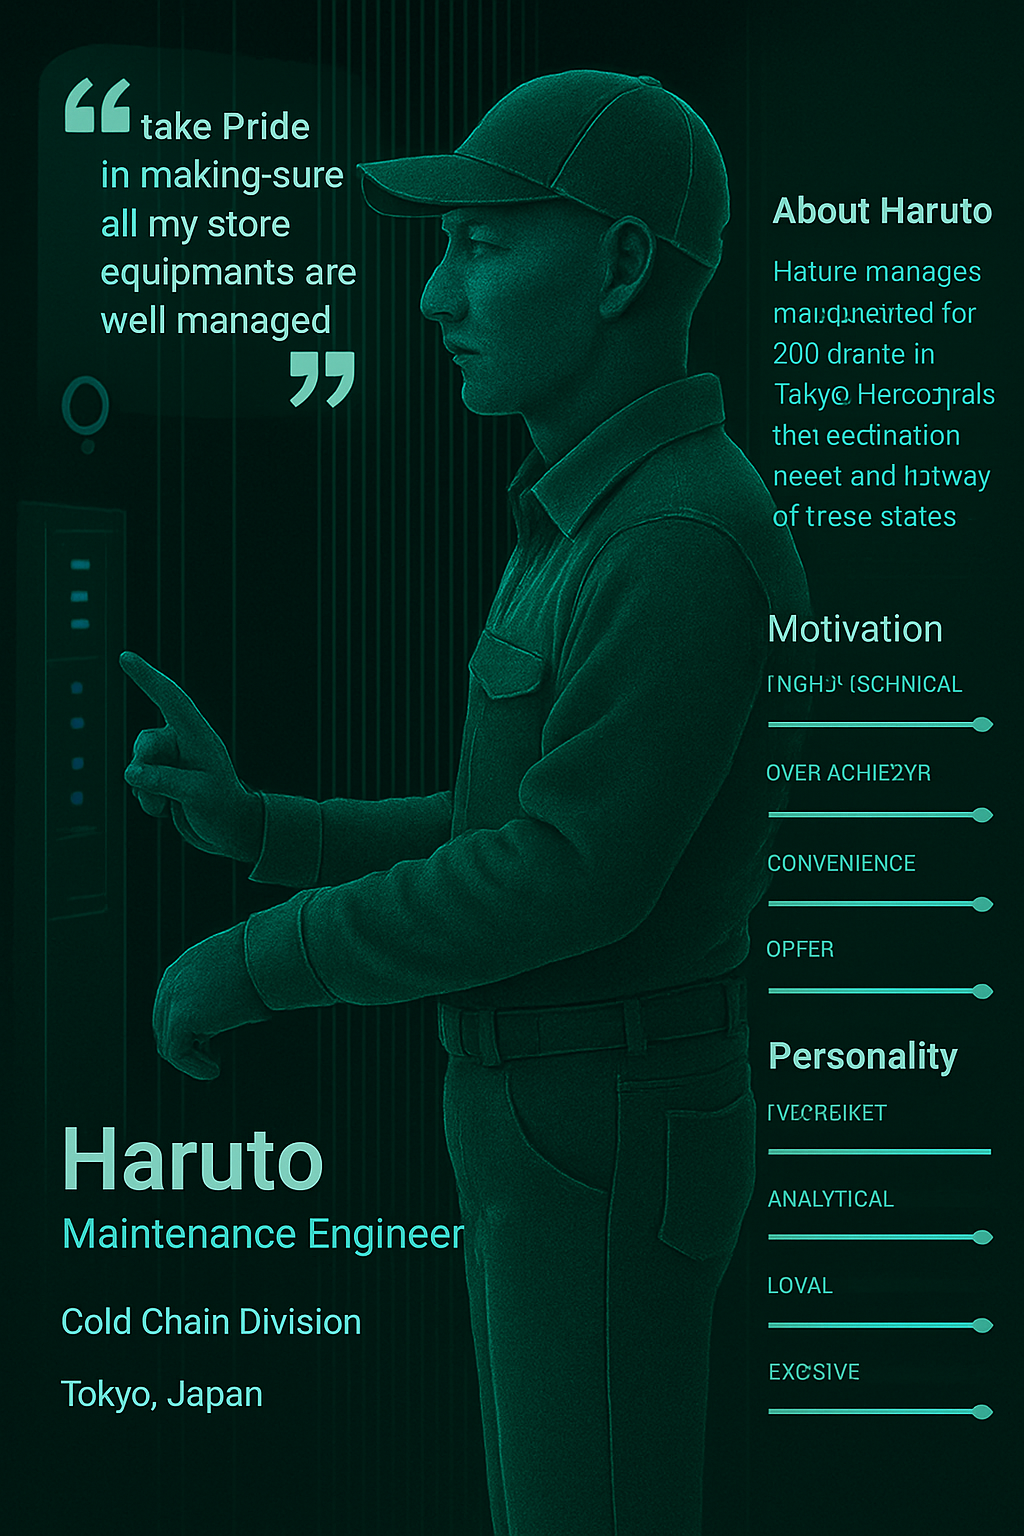

Created a fictional persona to help the team empathize with end users during early design conversations

Clearly communicated that the persona was a placeholder, and would be refined after conducting user research
Task Flow
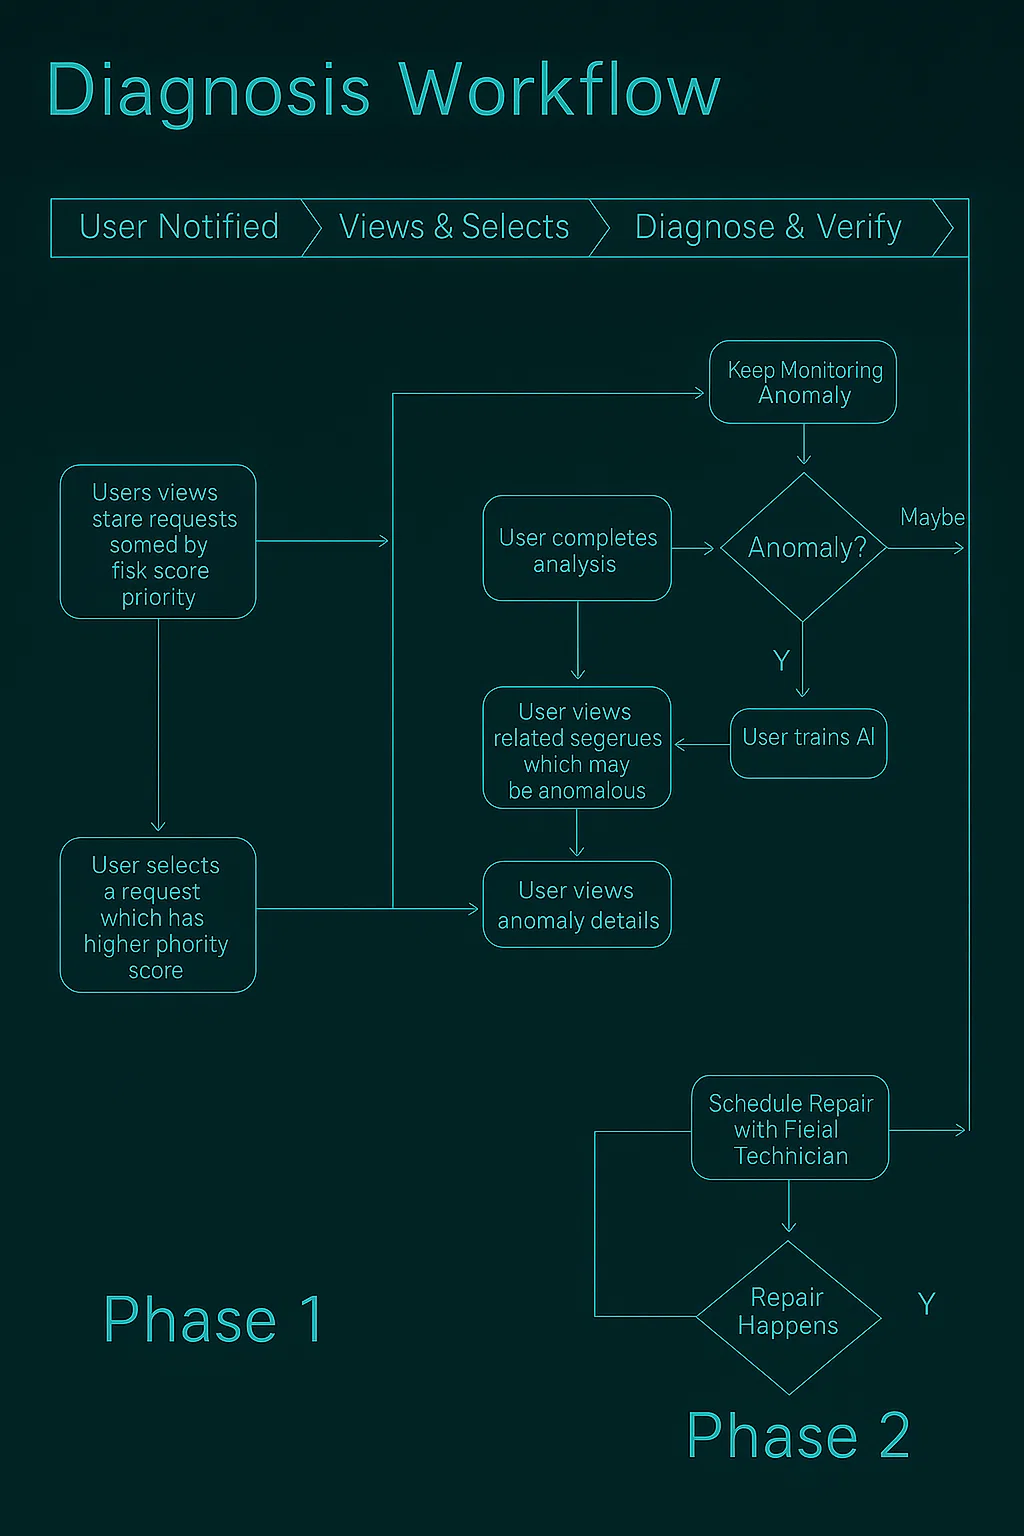

Created a draft task flow to help the team visualize the user journey for anomaly detection
Aligned on early user steps and system touchpoints to inform MVP direction
SETTING THE CONTEXT
Brought Clarity To An Ambiguous Problem Space
Brought clarity to troubleshooting by untangling alert noise and highlighting the true source of failure.
User Goal

Help Maintenance Engineers Diagnose Anomalous Equipment Cases Successfully
Success Criteria
Maintenance Engineers should be able to solve 10 Anomaly cases per day
DESIGN EXPLORATIONS
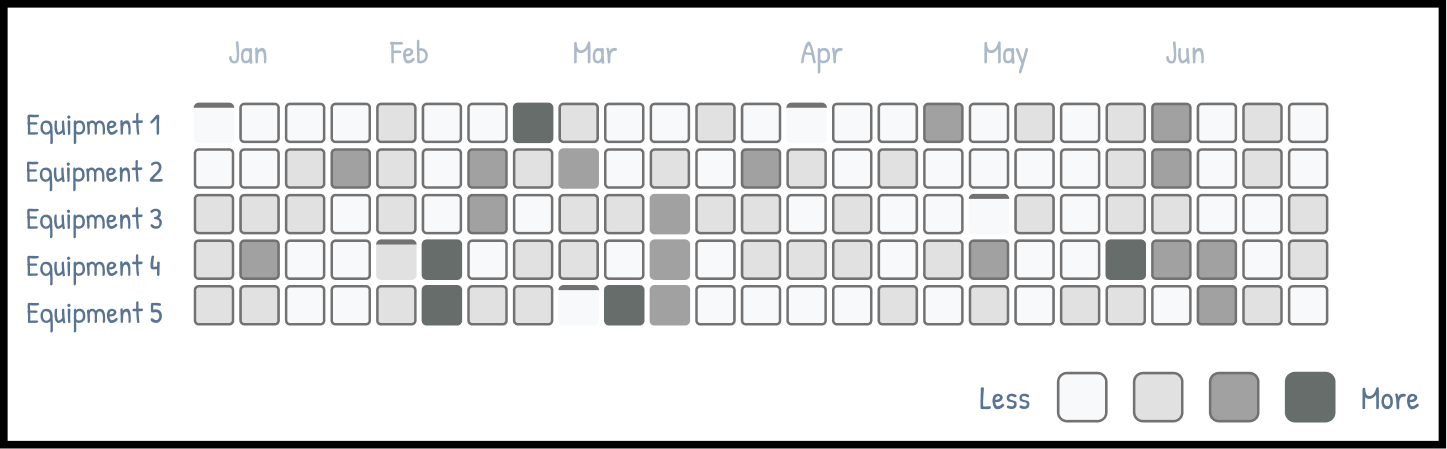
Exploration 1
Anomaly Heat map
Highlights when & where anomalies occurred across equipment & time.
Pros & Cons
🟢
Great for spotting temporal patterns
🟠
Doesn’t convey severity or resolution status
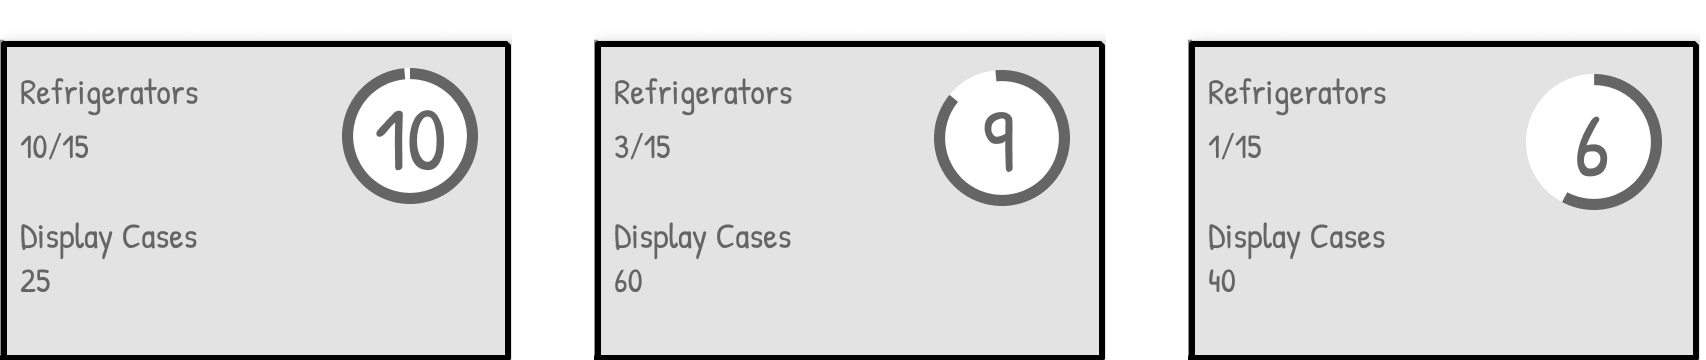
Exploration 2
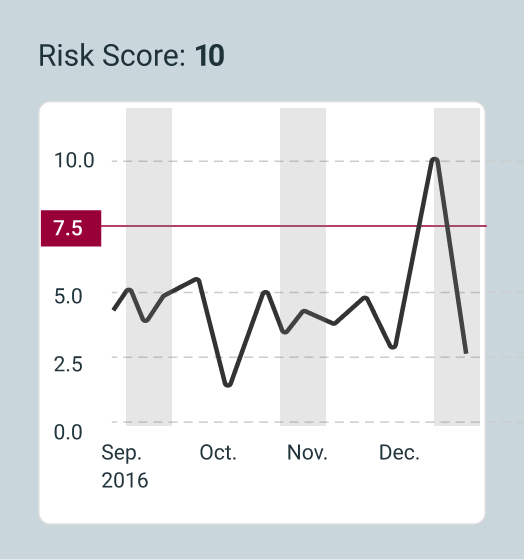
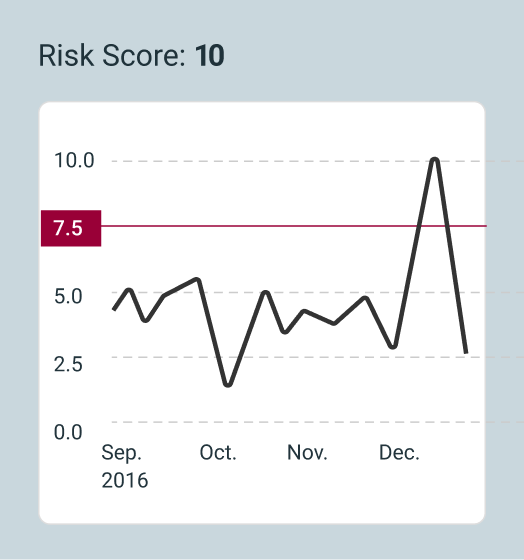
Risk Score Cards
Ranks equipment by failure risk using anomaly trends and past history.
Pros & Cons
🟢
Simple to scan and compare
🟢
Supports prioritization at a glance
🟠
Lacks deeper status context
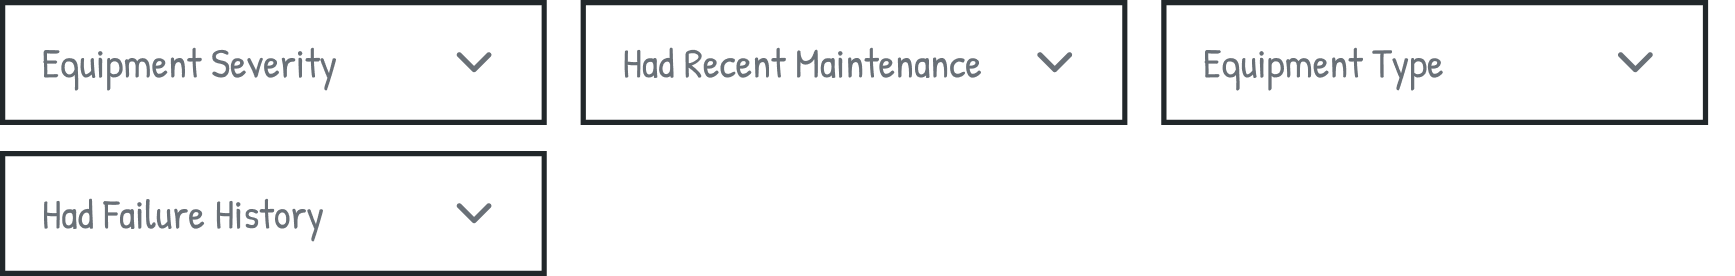
Exploration 3
Filters for Root Cause Analysis
Allow filtering based on severity, recent maintenance, or failure history.
Pros & Cons
🟢
Empowers engineers to narrow down issues quickly
🟢
Helps train AI by surfacing key variables
🟠
Requires upfront data model clarity
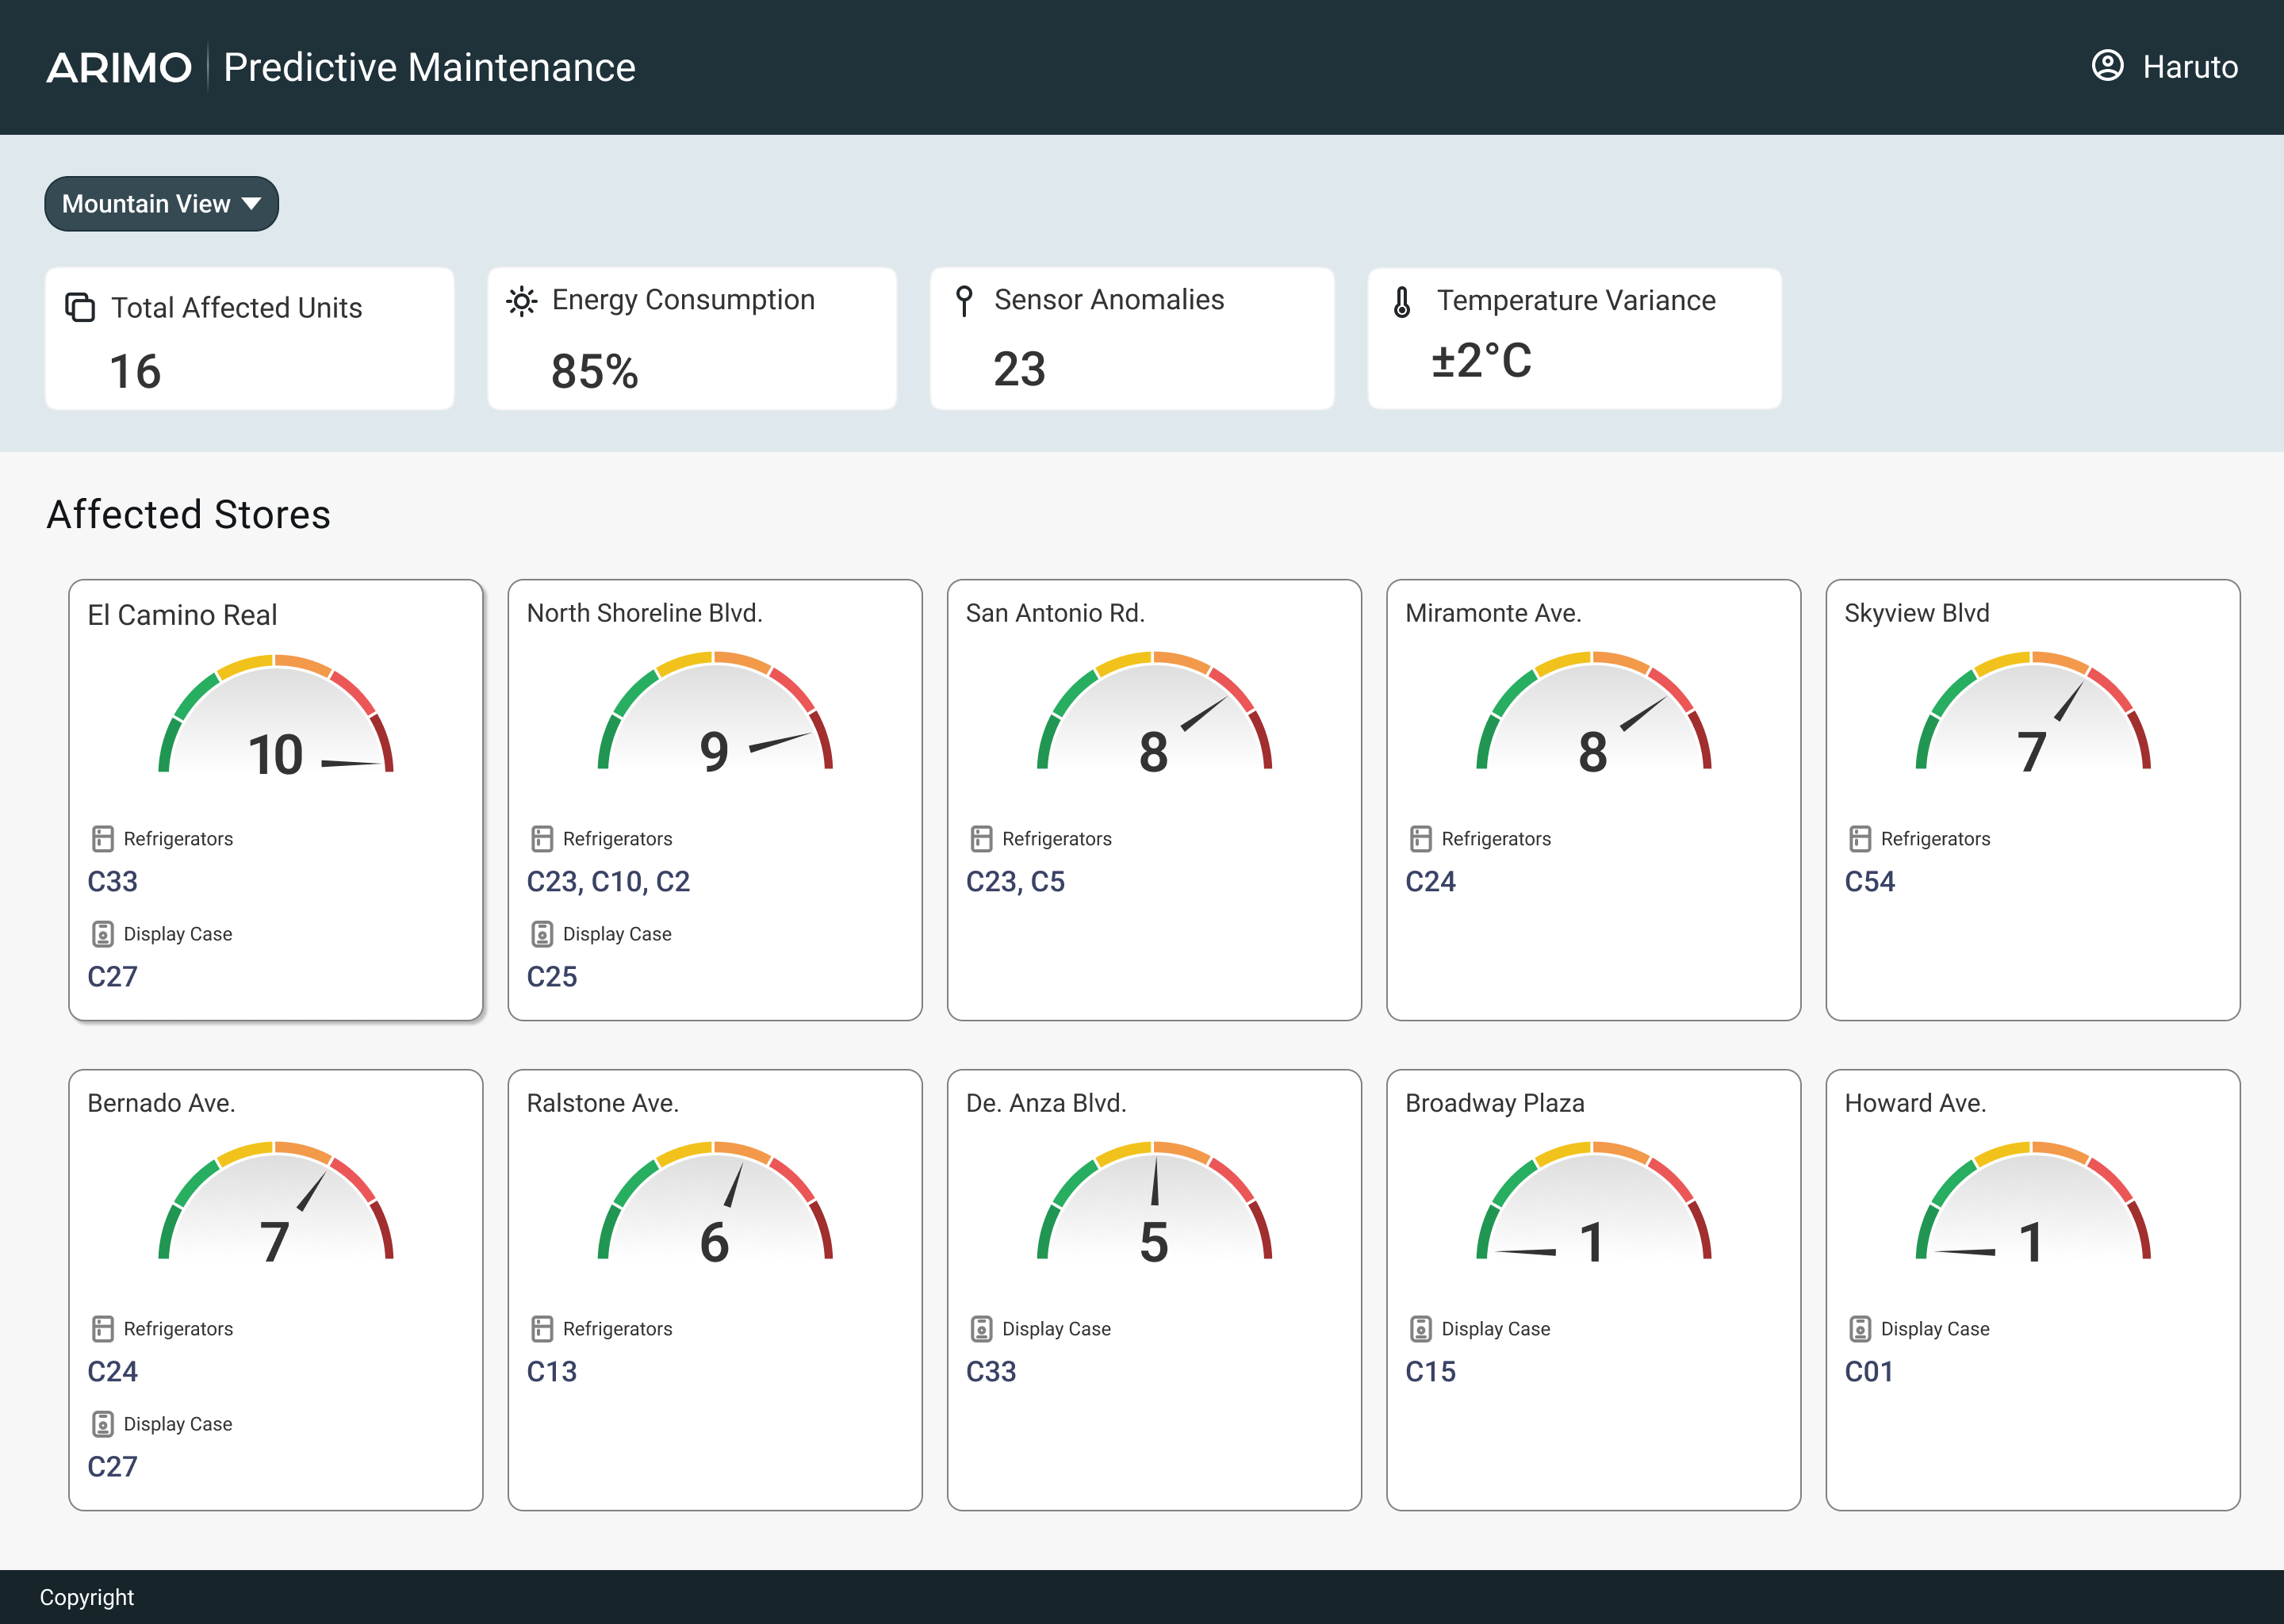
FINALIZED DESIGN OPTION - MVP
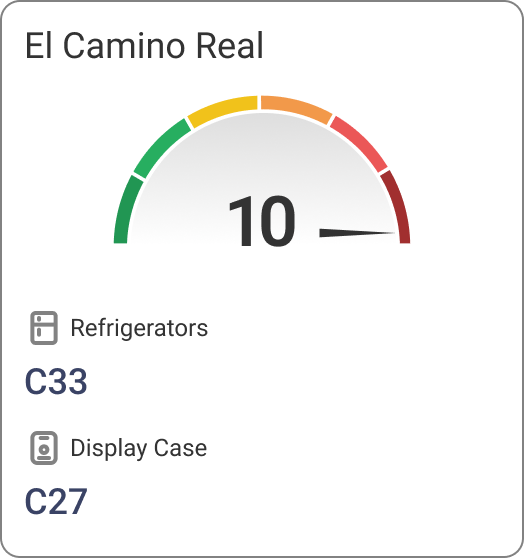
Surface highest-risk equipment fast
This landing page helps engineers quickly identify high-risk stores using a color-coded risk score (0–10), based on equipment count and anomaly volume. Key metrics like energy use and sensor anomalies support faster triage and resolution.
FINALIZED DESIGN OPTION - MVP
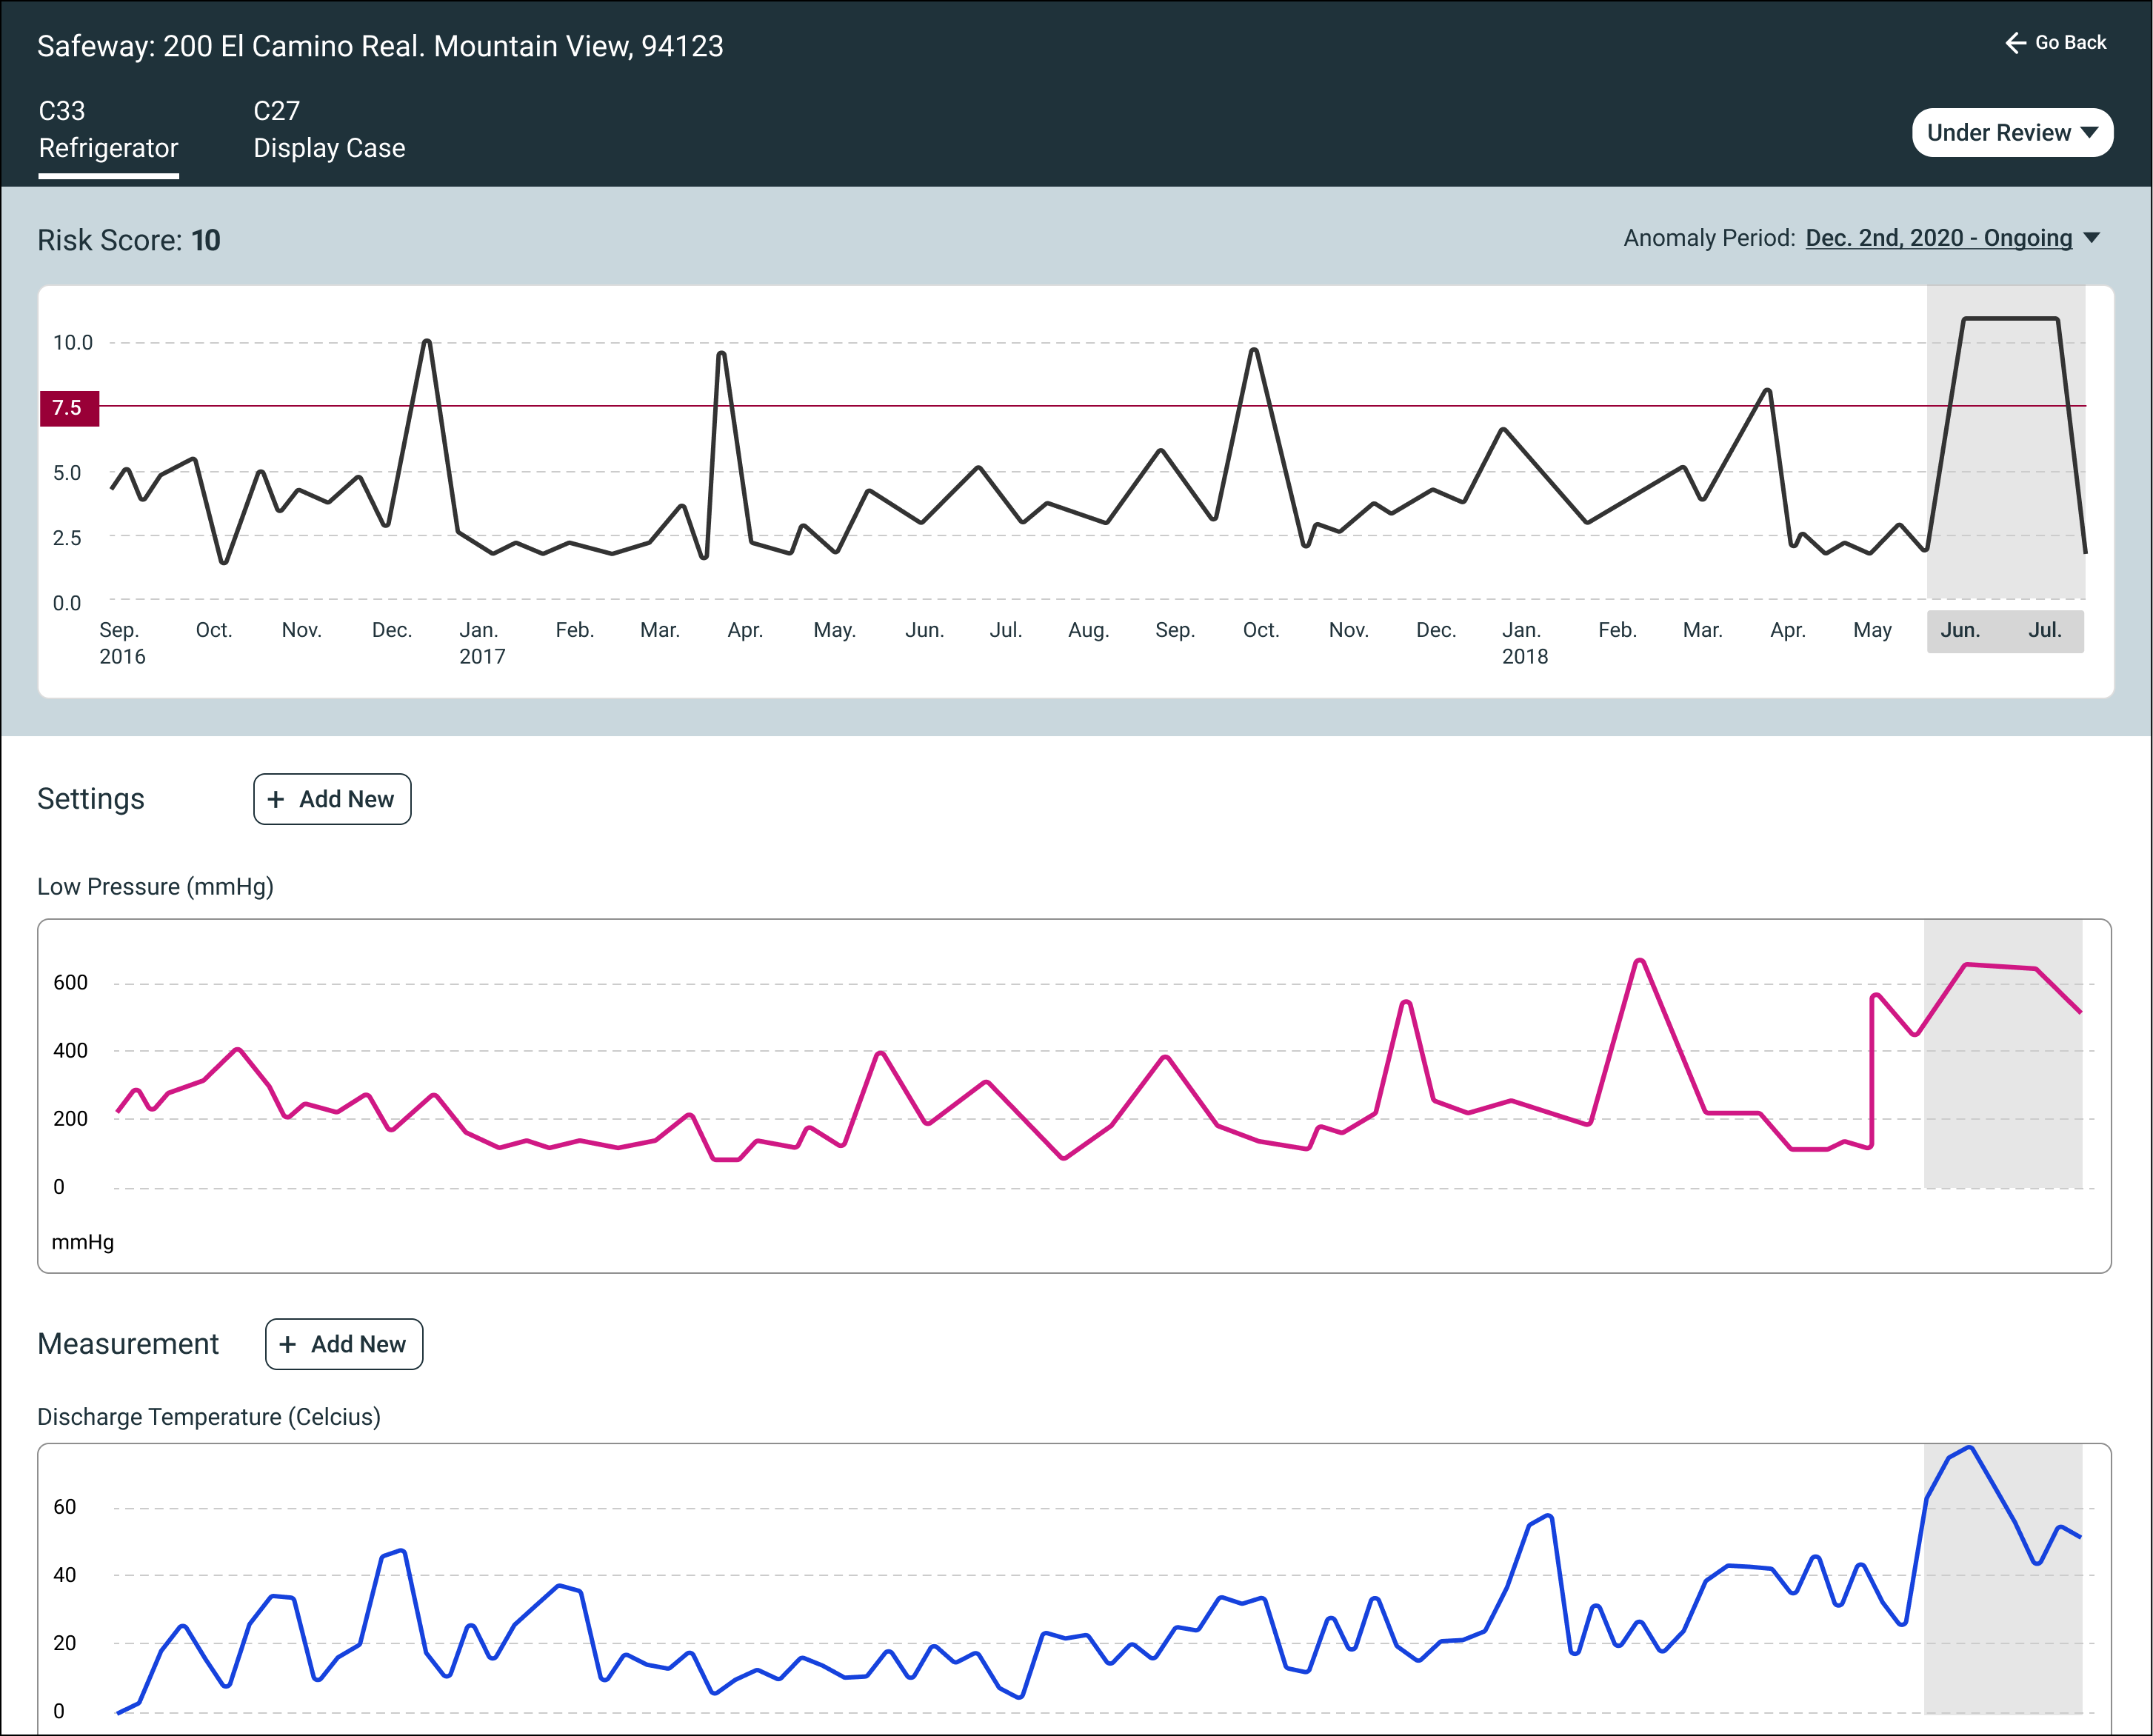
EQUIPMENT DETAILS VIEW
View top-risk equipment and explore root causes by adding settings or measurements.
USER RESEARCH & VALIDATION
Who we talked to and why it mattered
I engaged with 6 Maintanance Engineers real-world VI Admins to ensure the insights reflected real troubleshooting behaviors.
CANNOT ANALYZE ANOMALIES
Users didn’t understand how risk scores worked and wanted control to explore trends and plot anomalies.
WANTS DIAGNOSTIC HISTORY
Engineers needed access to past issues to compare current anomalies and learn from previous resolutions.
USERS EXPECTED ZOOMABLE GRAPHS
Users wanted interactive graphs that allowed zooming in and out to inspect anomalies more closely.
VERSION 2
Vision: Easy Analysis
Based on the research, we set our vision to improve the analysis experience for our users so that they could diagnose and complete more cases.
To Summarize
EMPATHY MAPPING
User Needs
Identified key investigation gaps for maintenance engineers through interviews and usability testing.
PRIMARY USER
Maintenance Engineers
Focused on resolving equipment anomalies across refrigeration and display case systems.
DESIGN GOAL
Improve Investigation Speed
Built tools to help engineers detect, review, and resolve anomalies faster and with less manual effort.
MEASURE SUCCESS
Product Value
Boosted resolution rates from 10 to 30 anomaly cases/day, delivering a 3× improvement post-launch.


Developer Experience
Troubleshooting Dashboard
Predictive Maintenance
About Raj
Predictive Maintenance
Proactively reduce downtime and improve field service efficiency
ANTICIPATE FAILURES, NOT JUST RESPOND TO THEM
Before this solution, maintenance engineers relied on customer complaints and repeated site visits to diagnose issues with refrigeration units. This reactive approach led to costly equipment replacements and poor customer experience.I designed the initial experience to help maintenance engineers teach the AI what anomalies may look like. By enabling engineers to analyze equipment behavior and label anomalies, we accelerated the model’s learning while surfacing early warning signs of failure.

Complex Domain

Cross-functional Collaboration

MVP Design Under Ambiguity
MY ROLE
Principal UX Designer
COMPANY
Panasonic
IMPROVING ANOMALY DETECTION AND TEACHING AI
Initial predictive maintenance dashboard enabling engineers to label anomalies and train the model
PRODUCTIVITY GAIN
3x
Engineers resolved 30 anomaly cases/day (vs. 10/day originally)
MODEL TRAINING
Faster AI learning
Human input accelerated anomaly detection and pattern recognition
BACKGROUND
Panasonic


Sells & Maintains Refrigerators
To

Large Scale
Grocery Stores


Nationwide UseAll Over Japan
PROJECT BACKGROUND
Top Frustrations Shared by VI Admins During Contexual Enquriry
The Data Science & Panasonic Cold Chain teams had spent 18 months building an AI model.
It was time to visualize this work. I had only 2 weeks of design time.
The biggest challenge? I didn’t know anything about the users and how do they mitigate issues.
I influenced the team to consider the MVP as an hypothesis to be validated post implementation
DESIGN WORKSHOP SESSIONS
Pre-Design Workshop for MVP Direction
Why it mattered:
Before designing the MVP, we needed clarity on:
- Project goals
- Target users
- The meaning of product scalability
Without this, the MVP risked misalignment with long-term vision.
What I did:
- Facilitated a pre-design workshop to gather diverse inputs
- Defined the agenda and prepared materials in advance
- Ensured participation from product, engineering, and business stakeholders
- Ran warm-up exercises to encourage open discussion
- Captured insights on user needs and scalability definitions
The result:
The session helped frame the MVP with shared understanding. It reinforced that design isn’t done in a silo and ideas emerged from across teams.
DESIGN WORKSHOP OUTPUT
Collaboration With Product Management, Engineering & Data Scientists
Persona
Created a fictional persona to help the team empathize with end users during early design conversations
Clearly communicated that the persona was a placeholder, and would be refined after conducting user research
Task Flow
Created a draft task flow to help the team visualize the user journey for anomaly detection
Aligned on early user steps and system touchpoints to inform MVP direction

SETTING THE CONTEXT
Brought Clarity To An Ambiguous Problem Space
Framed the goal as helping maintenance engineers diagnose anomalies, not just detect alerts and product set the success metrics.
User Goal

Help Maintenance Engineers Diagnose Anomalous Equipment Cases Successfully
Success Criteria
Maintenance Engineers should be able to solve 10 Anomaly cases per day
DESIGN EXPLORATIONS
Exploration 1
Anomaly Heat map
Highlights when & where anomalies occurred across equipment & time.
Pros & Cons
🟢
Great for spotting temporal patterns
🟠
Doesn’t convey severity or resolution status
Exploration 2
Risk Score Cards
Ranks equipment by failure risk using anomaly trends and past history.
Pros & Cons
🟢
Simple to scan and compare
🟢
Supports prioritization at a glance
🟠
Lacks deeper status context
Exploration 3
Filters for Root Cause Analysis
Allow filtering based on severity, recent maintenance, or failure history.
Pros & Cons
🟢
Empowers engineers to narrow down issues quickly
🟢
Helps train AI by surfacing key variables
🟠
Requires upfront data model clarity
Equipment Severity

Recent Maintenance
Equipment Type
Equipment Failure
FINALIZED DESIGN OPTION - MVP
Surface highest-risk equipment fast
This landing page helps engineers quickly identify high-risk stores using a color-coded risk score (0–10), based on equipment count and anomaly volume. Key metrics like energy use and sensor anomalies support faster triage and resolution.
FINALIZED DESIGN OPTION - MVP
EQUIPMENT DETAILS VIEW
View top-risk equipment and explore root causes by adding settings or measurements.
USER RESEARCH & VALIDATION
Who we talked to and why it mattered
I engaged with 6 Maintanance Engineers real-world VI Admins to ensure the insights reflected real troubleshooting behaviors.
CANNOT ANALYZE ANOMALIES
Users didn’t understand how risk scores worked and wanted control to explore trends and plot anomalies.
WANTS DIAGNOSTIC HISTORY
Engineers needed access to past issues to compare current anomalies and learn from previous resolutions.
USERS EXPECTED ZOOMABLE GRAPHS
Users wanted interactive graphs that allowed zooming in and out to inspect anomalies more closely.
VERSION 2
Vision: Easy Analysis
Based on the research, we set our vision to improve the analysis experience for our users so that they could diagnose and complete more cases.
To Summarize
EMPATHY MAPPING
User Needs
Identified key investigation gaps for maintenance engineers through interviews and usability testing.
PRIMARY USER
Maintenance Engineers
Focused on resolving equipment anomalies across refrigeration and display case systems.
DESIGN GOAL
Improve Investigation Speed
Built tools to help engineers detect, review, and resolve anomalies faster and with less manual effort.
MEASURE SUCCESS
Product Value
Boosted resolution rates from 10 to 30 anomaly cases/day, delivering a 3× improvement post-launch.
Developer Experience
Troubleshooting Dashboard
Predictive Maintenance
About Raj
Predictive Maintenance
Empower developers with end-to-end visibility from build to production.
ANTICIPATE FAILURES, NOT JUST RESPOND TO THEM
Before this solution, maintenance engineers relied on customer complaints and repeated site visits to diagnose issues with refrigeration units. This reactive approach led to costly equipment replacements and poor customer experience.I designed the initial experience to help maintenance engineers teach the AI what anomalies may look like. By enabling engineers to analyze equipment behavior and label anomalies, we accelerated the model’s learning while surfacing early warning signs of failure.

Complex Domain

Cross-functional Collaboration

MVP Design Under Ambiguity
MY ROLE
Principal UX Designer
COMPANY
Panasonic
IMPROVING ANOMALY DETECTION AND TEACHING AI
Initial predictive maintenance dashboard enabling engineers to label anomalies and train the model
PRODUCTIVITY GAIN
3x
Engineers resolved 30 anomaly cases/day (vs. 10/day originally)
MODEL TRAINING
Faster AI learning
Human input accelerated anomaly detection and pattern recognition
BACKGROUND
Panasonic
Sells & Maintains Refrigerators
To
Large Scale
Grocery Stores
Nationwide UseAll Over Japan
PROJECT BACKGROUND
Top Frustrations Shared by VI Admins During Contexual Enquriry
The Data Science & Panasonic Cold Chain teams had spent 18 months building an AI model.
It was time to visualize this work. I had only 2 weeks of design time.
The biggest challenge? I didn’t know anything about the users and how do they mitigate issues.
I influenced the team to consider the MVP as an hypothesis to be validated post implementation
DESIGN WORKSHOP SESSIONS
Pre-Design Workshop for MVP Direction
Why it mattered:
Before designing the MVP, we needed clarity on:
- Project goals
- Target users
- The meaning of product scalability
Without this, the MVP risked misalignment with long-term vision.
What I did:
- Facilitated a pre-design workshop to gather diverse inputs
- Defined the agenda and prepared materials in advance
- Ensured participation from product, engineering, and business stakeholders
- Ran warm-up exercises to encourage open discussion
- Captured insights on user needs and scalability definitions
The result:
The session helped frame the MVP with shared understanding. It reinforced that design isn’t done in a silo and ideas emerged from across teams.
DESIGN WORKSHOP OUTPUT
Collaboration With Product Management, Engineering & Data Scientists
Persona

Created a fictional persona to help the team empathize with end users during early design conversations
Clearly communicated that the persona was a placeholder, and would be refined after conducting user research
Task Flow
Created a draft task flow to help the team visualize the user journey for anomaly detection
Aligned on early user steps and system touchpoints to inform MVP direction
SETTING THE CONTEXT
Brought Clarity To An Ambiguous Problem Space
Framed the goal as helping maintenance engineers diagnose anomalies, not just detect alerts and product set the success metrics.
User Goal
Help Maintenance Engineers Diagnose Anomalous Equipment Cases Successfully
Success Criteria
Maintenance Engineers should be able to solve 10 Anomaly cases per day
DESIGN EXPLORATIONS
Exploration 1
Anomaly Heat map
Highlights when & where anomalies occurred across equipment & time.
Pros & Cons
🟢
Great for spotting temporal patterns
🟠
Doesn’t convey severity or resolution status
Exploration 2
Risk Score Cards
Ranks equipment by failure risk using anomaly trends and past history.
Pros & Cons
🟢
Simple to scan and compare
🟢
Supports prioritization at a glance
🟠
Lacks deeper status context
Exploration 3
Filters for Root Cause Analysis
Allow filtering based on severity, recent maintenance, or failure history.
Pros & Cons
🟢
Empowers engineers to narrow down issues quickly
🟢
Helps train AI by surfacing key variables
🟠
Requires upfront data model clarity
Equipment Severity

Recent Maintenance

Equipment Type

Equipment Failure
FINALIZED DESIGN OPTION - MVP
Surface highest-risk equipment fast
This landing page helps engineers quickly identify high-risk stores using a color-coded risk score (0–10), based on equipment count and anomaly volume. Key metrics like energy use and sensor anomalies support faster triage and resolution.
FINALIZED DESIGN OPTION - MVP
EQUIPMENT DETAILS VIEW
View top-risk equipment and explore root causes by adding settings or measurements.
USER RESEARCH & VALIDATION
Who we talked to and why it mattered
I engaged with 6 Maintanance Engineers real-world VI Admins to ensure the insights reflected real troubleshooting behaviors.
CANNOT ANALYZE ANOMALIES
Users didn’t understand how risk scores worked and wanted control to explore trends and plot anomalies.
USERS EXPECTED ZOOMABLE GRAPHS
Users wanted interactive graphs that allowed zooming in and out to inspect anomalies more closely.
WANTS DIAGNOSTIC HISTORY
Engineers needed access to past issues to compare current anomalies and learn from previous resolutions.
VERSION 2
Vision: Easy Analysis
Based on the research, we set our vision to improve the analysis experience for our users so that they could diagnose and complete more cases.
To Summarize
EMPATHY MAPPING
User Needs
Identified key investigation gaps for maintenance engineers through interviews and usability testing.
PRIMARY USER
Maintenance Engineers
Focused on resolving equipment anomalies across refrigeration and display case systems.
DESIGN GOAL
Improve Investigation Speed
Built tools to help engineers detect, review, and resolve anomalies faster and with less manual effort.
MEASURE SUCCESS
Product Value
Boosted resolution rates from 10 to 30 anomaly cases/day, delivering a 3× improvement post-launch.
Developer Experience
Troubleshooting Dashboard
Predictive Maintenance
About Raj
Predictive Maintenance
Proactively reduce downtime and improve field service efficiency
ANTICIPATE FAILURES, NOT JUST RESPOND TO THEM
Before this solution, maintenance engineers relied on customer complaints and repeated site visits to diagnose issues with refrigeration units. This reactive approach led to costly equipment replacements and poor customer experience.I designed the initial experience to help maintenance engineers teach the AI what anomalies may look like. By enabling engineers to analyze equipment behavior and label anomalies, we accelerated the model’s learning while surfacing early warning signs of failure.
Complex AI Workflow
Cross-functional Collaboration
MVP Design Under Ambiguity
MY ROLE
Principal UX Designer
COMPANY
Panasonic
IMPROVING ANOMALY DETECTION AND TEACHING AI
Initial predictive maintenance dashboard enabling engineers to label anomalies and train the model
PRODUCTIVITY GAIN
3x
Engineers resolved 30 anomaly cases/day (vs. 10/day originally)
MODEL TRAINING
Faster AI learning
Human input accelerated anomaly detection and pattern recognition
BACKGROUND
Panasonic
Sells & Maintains Refrigerators
To
Large Scale
Grocery Stores
Nationwide UseAll Over Japan
PROJECT BACKGROUND
What Led to the Predictive Maintenance MVP
The Data Science & Panasonic Cold Chain teams had spent 18 months building an AI model.
It was time to visualize this work. I had only 2 weeks of design time.
The biggest challenge? I didn’t know anything about the users and how do they mitigate issues.
I influenced the team to consider the MVP as an hypothesis to be validated post implementation
DESIGN WORKSHOP SESSIONS
Pre-Design Workshop for MVP Direction
Why it mattered:
Before designing the MVP, we needed clarity on:
- Project goals
- Target users
- The meaning of product scalability
Without this, the MVP risked misalignment with long-term vision.
What I did:
- Facilitated a pre-design workshop to gather diverse inputs
- Defined the agenda and prepared materials in advance
- Ensured participation from product, engineering, and business stakeholders
- Ran warm-up exercises to encourage open discussion
- Captured insights on user needs and scalability definitions
The result:
The session helped frame the MVP with shared understanding. It reinforced that design isn’t done in a silo and ideas emerged from across teams.
DESIGN WORKSHOP OUTPUT
Collaboration With Product Management, Engineering & Data Scientists
Persona

Created a fictional persona to help the team empathize with end users during early design conversations
Clearly communicated that the persona was a placeholder, and would be refined after conducting user research
Task Flow
Created a draft task flow to help the team visualize the user journey for anomaly detection
Aligned on early user steps and system touchpoints to inform MVP direction
SETTING THE CONTEXT
Brought Clarity To An Ambiguous Problem Space
Framed the goal as helping maintenance engineers diagnose anomalies, not just detect alerts and product set the success metrics.
User Goal
Help Maintenance Engineers Diagnose Anomalous Equipment Cases Successfully
Success Criteria
Maintenance Engineers should be able to solve 10 Anomaly cases per day
DESIGN EXPLORATIONS
Exploration 1
Anomaly Heat map
Highlights when & where anomalies occurred across equipment & time.
Pros & Cons
🟢
Great for spotting temporal patterns
🟠
Doesn’t convey severity or resolution status
Exploration 2
Risk Score Cards
Ranks equipment by failure risk using anomaly trends and past history.
Pros & Cons
🟢
Simple to scan and compare
🟢
Supports prioritization at a glance
🟠
Lacks deeper status context
Exploration 3
Filters for Root Cause Analysis
Allow filtering based on severity, recent maintenance, or failure history.
Pros & Cons
🟢
Empowers engineers to narrow down issues quickly
🟢
Helps train AI by surfacing key variables
🟠
Requires upfront data model clarity
Equipment Severity

Recent Maintenance
Equipment Type
Equipment Failure
FINALIZED DESIGN OPTION - MVP
Surface highest-risk equipment fast
This landing page helps engineers quickly identify high-risk stores using a color-coded risk score (0–10), based on equipment count and anomaly volume. Key metrics like energy use and sensor anomalies support faster triage and resolution.
FINALIZED DESIGN OPTION - MVP
Spot trends, find root causes
View top-risk equipment and explore root causes by adding settings or measurements.
USER RESEARCH & VALIDATION
Who we talked to and why it mattered
I facilitated research with 6 maintenance engineers to understand their demographics, pain points, and experience with the first version.
CANNOT ANALYZE ANOMALIES
Users didn’t understand how risk scores worked and wanted control to explore trends and plot anomalies.
USERS EXPECTED ZOOMABLE GRAPHS
Users wanted interactive graphs that allowed zooming in and out to inspect anomalies more closely.
WANTS DIAGNOSTIC HISTORY
Engineers needed access to past issues to compare current anomalies and learn from previous resolutions.
VERSION 2
Vision: Easy Analysis
Based on the research, we set our vision to improve the analysis experience for our users so that they could diagnose and complete more cases.
To Summarize
EMPATHY MAPPING
User Needs
Identified key investigation gaps for maintenance engineers through interviews and usability testing.
PRIMARY USER
Maintenance Engineers
Focused on resolving equipment anomalies across refrigeration and display case systems.
DESIGN GOAL
Improve Investigation Speed
Built tools to help engineers detect, review, and resolve anomalies faster and with less manual effort.
MEASURE SUCCESS
Product Value
Boosted resolution rates from 10 to 30 anomaly cases/day, delivering a 3× improvement post-launch.